November began with the technology rally still firmly in motion, with the largest firms driving returns across developed markets. As has often been the case, it was a small group of mega cap companies doing most of the heavy lifting, led again by the US. At the end of October, the top seven firms made up roughly 37% of the US market and were responsible for generating almost half of the gains for the year.
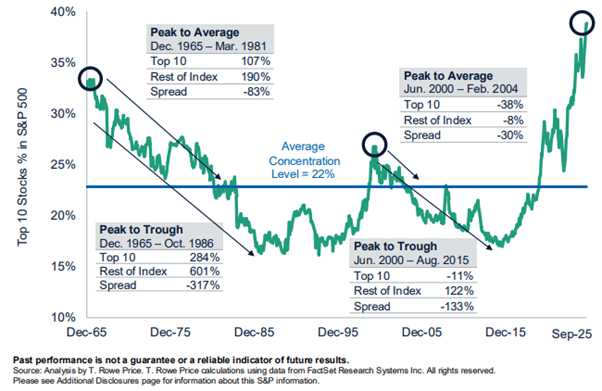
The chart below illustrates the way the share of the main US market taken up by the top ten stocks has changed since the end of 1965. It shows that over this extended period, the market has tended to broaden after each peak. This is shown either by the fall to the average concentration for the period (the blue line), or to the low point (trough). As highlighted in the data boxes, this happens when the top ten stocks are outpaced by the performance of the other 490 companies. Importantly, this has historically been because the other stocks have enjoyed a much stronger run, rather than because the market as a whole has struggled.
S&P 500 historical concentration levels
Nvidia, the world’s largest company, had continued to dominate the narrative. It grew from $4trillion to over $5trillion in the space of three months. Or putting it another way, it took more than six thousand days for the company to reach its first trillion dollars of market value, and fewer than six hundred days to rise from one to five.
Of course, as we’ve highlighted previously, such narrow leadership tends to leave little room for error. This became evident in the opening weeks of our new quarter. Several well-known names, including Meta and Oracle, suffered share price falls that left them some 20% below their previous highs as investors started to show signs of concern.
This wobble reflects three connected concerns. The first is the sheer scale of spending planned by what have begun to be called “hyperscalers”. Around $200bn has already been spent in 2025 and that figure is expected to almost double in each of the next two years. This money is being used to build the enormous datacenters which are required to house the computers which power the AI boom.
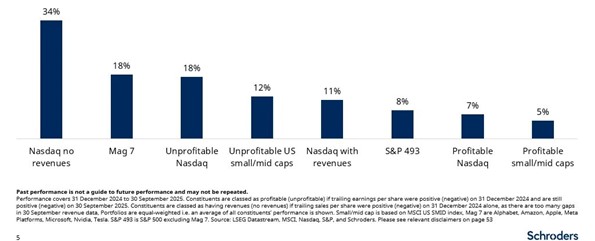
Importantly, a growing share of this expenditure is now being funded through debt rather than profits. This has the potential to create larger problems in the future if the expected benefits do not materialise. There is also increasing focus on how the strongest performance this year has been focused on companies with the smallest revenues or profits.
The chart below encapsulates this trend and shows the performance of different segments of the wider US market. This includes the Nasdaq (the tech-focused index), the Mag(nificent) 7 technology stocks, the remaining 493 stocks in the main index, and smaller or mid cap stocks (i.e. those with lower valuations than other companies). This shows the very strong corelation between profits (or lack thereof) and performance we have seen so far this year.
Average year-to-date performance of companies in different categories
The second concern is how closely linked the largest firms have become. Nvidia designs the most advanced chips (and provides the software to use them), they’re manufactured by one company in Taiwan (which sits just over 100 miles off the coast of China), and they’re sold to the biggest technology companies which install them in their data centres to support the development of their large language models.
Many of the recent deals have included complicated lease arrangements, with Nvidia lending money to other firms that then use those funds to buy Nvidia’s chips. It is also worth noting that these chips also have limited lifespans. Companies cannot simply store today’s hardware for future use, which means they must keep upgrading.
The third concern is the pressure surrounding Nvidia’s earnings. We are now in a situation where the focus of the entire market is on this one company in the days leading up to each results announcement. Ahead of the latest update last month, this speculation was particularly intense. Nvidia is worth so much and is such a large part of the market that even moderate share price moves equate to a value larger than the total value of all but the largest fifty or so companies worldwide.
In the event, the company's performance was better than had been forecast, with revenues of $57bn in just the three month period to the end of October. The immediate market reaction was predictably strong. Nvidia’s shares rose more than 5% in advance of the opening of the market, and indices in Asia and Europe also moved higher. However, as the day progressed, sentiment shifted and most of the largest firms finished lower, including an 8% swing for Nvidia that saw them finish in the red.
Nvidia’s dramatic day
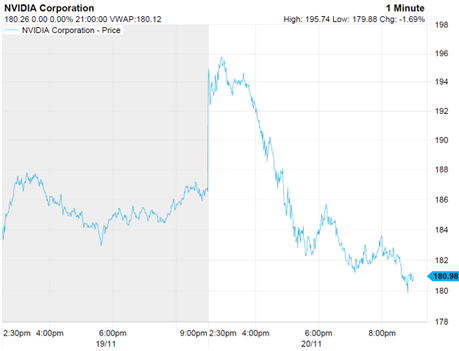
Source: Factset
For us, the question has never been whether Nvidia is profitable. It clearly is, and then some. The debate is whether the huge sums being spent across the industry will translate into useful and lasting output. Nvidia has contracts with some of the largest and the fastest growing companies in the world and is central to the AI theme. Comparisons with past gold rushes are difficult to avoid. Nvidia is effectively selling the picks and shovels to the firms doing the digging, but the long-term benefits of that activity remain uncertain.
There is an interesting recent example of how quickly a company can swing from being absolutely central to a theme to struggling to compete. Novo Nordisk, the Danish healthcare company, was until recently the most valuable company in Europe thanks to its advances in revolutionary weight loss drugs. At its peak its shares were worth over 1000 Danish krona and it was lining up all sorts of deals to bolster its growth. Now its shares are priced at just 300 krona and it has replaced its CEO, all because other companies have released rival treatments.
We should be clear that there are a lot of reasons why Nvidia is protected from this outcome, not least the difficulty in producing the very highest end chips. But when the success or failure of global markets rely on the results of a single firm, it’s obviously important to be aware of the risks.
The bulk of recent investment chatter has focused on the idea that we are in an equity bubble, with the implication that if it pops, volatility would sharply rise. However, the trouble with bubbles is that you only know when they’ve popped in hindsight. Even though equity markets are at record highs, it is entirely possible that they will keep rising for some time yet so our preference is to remain cautiously exposed to avoid missing out on what remains of this remarkable run.
This approach continues to guide our thinking. We remain focused on valuations and on maintaining a sensible spread across regions and asset classes, with a clear aim of delivering returns over the long term rather than reacting to short term market speculation.
Market and sector summary to the end of November 2025
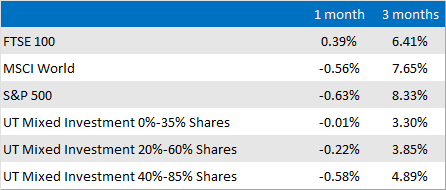
Source: Financial Express Analytics.
Past performance is not a guide to future performance, nor a reliable indicator of future results or performance.