Thank you to everyone who has already responded to the latest review of the IMS portfolios which was sent out last month. We’ve had an excellent response so far, but if you have not yet had an opportunity to send us your acceptance, we would be grateful if you could so that we can make sure your investments are in the latest fund selection. You can respond to this message if you would like another copy of the review to be sent out.
“When America sneezes, the rest of the world catches a cold.” This phrase is often used to describe the importance of the US for the rest of the world because any weakness in the world’s most powerful country inevitably feeds through to all of us. Originally used to refer to the political power of France, the phrase is now commonly trotted out whenever there are wobbles in the American financial system.
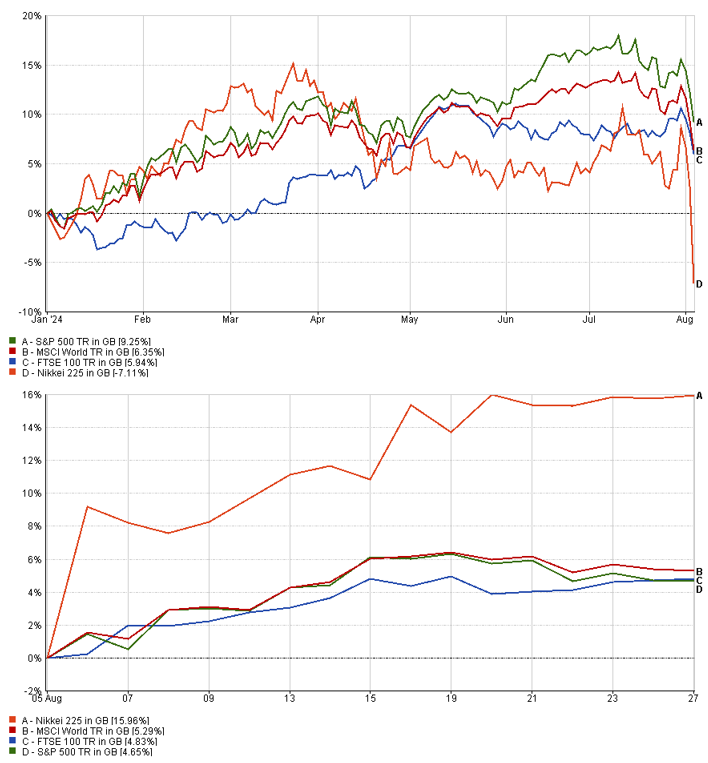
The maxim had another airing at the start of August when a number of factors combined to send global stock markets tumbling. I wrote about this at the time (the article is available to read here), but now that the dust has settled, it is possible to look back at what happened with a little more clarity.
Market volatility and recovery in August 2024

Source: Financial Express Analytics, 01/01/2024-05/08/2024 & 05/08/2024-27/08/2024
The cause of the volatility was an economic earthquake with two epicentres; one was focused on the impact of a minor change by the Central Bank of Japan (BoJ) which had major consequences, while the other centred concerns about the American economy and on the prospects for its largest companies.
The first trigger was a surprise decision by the BoJ to raise interest rates sooner than had been expected. Having only ended its negative interest rate policy in March after eight years, the bank said on the final day of July that it would be moving to a rate of around 0.25%. This was only the second time in 17 years that it had increased rates and although traders had known that another rise was on the cards, this was well ahead of the 2025 timeframe that most had assumed.
The problem for markets was around something referred to as “the carry trade”. At its core, this trading strategy involves borrowing funds in a low-interest rate currency (like the Japanese yen) and using them to invest in stock and bonds based on a currency with higher interest rates. The difference in interest rates generates a profit, known as the carry, and many billions of dollars were invested to take advantage of this opportunity.
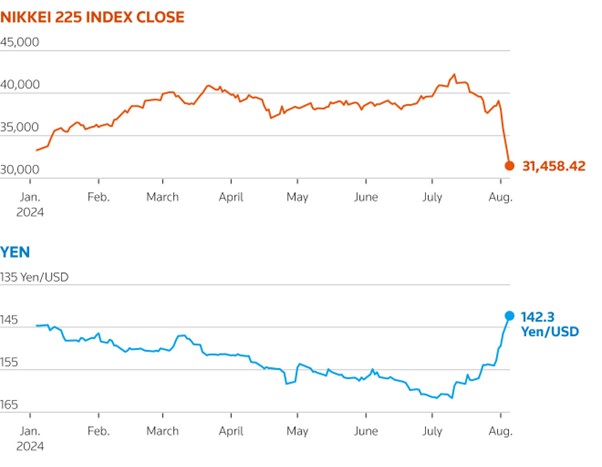
The BoJ's rate hike, coming earlier than anticipated, effectively reversed the low-interest rate environment that had fuelled the carry trade. As the cost of borrowing in yen increased (albeit marginally), traders were forced to unwind their positions to avoid potential losses. The sudden selling pressure on these higher-yielding assets contributed to a sharp decline in their prices. Moreover, the unwinding of carry trade positions led to a surge in demand for the Japanese yen, as traders sought to repay their loans. This rise in the value of the yen was bad news for the country’s exporters and further exacerbated the downward pressure on other currencies and assets, contributing to the overall market volatility.
Market dynamics in action

Source: WEF, 01/01/2024-05/08/2024
However, in a recent parliamentary hearing, the governor of the BoJ defended the bank’s decision. He told MPs that he and his colleagues had made the right choice for Japan and that there would be no change to their stance that rates would increase further to a more “normal” level if economic conditions allowed. He also insisted that they believed that recent volatility had primarily been caused by the second factor noted above: concerns around the US economy.
I’ve covered a lot of these worries in both the quarterly review as well as the recent interim update so I won’t cover the same ground here. In short, the question about whether the US economy can avoid a recession after a period of increasing interest rates has returned to the fore. This is compounded by the enormous valuations for the largest American companies which have been inflated by expectations of continued high growth.
It has been the case for some time that investing actively in the US (using a fund manager to select specific stocks) has played second fiddle to taking a passive approach and simply owning the market directly. As these funds track market indices like the S&P 500, they are compelled to buy and hold the largest companies, driving up their valuations. This, in turn, attracts more investors seeking to capitalise on the performance of these mega-cap stocks, creating a positive feedback loop that further amplifies their dominance.
As a result, the biggest stocks have grown disproportionately compared to smaller companies which creates issues when investors get spooked as they did at the start of last month. For one, if they need to sell their holdings, they tend to start with the largest because they’re the quickest to cash in. We saw what this can look like in 2022 when the five largest companies fell by as much half as of their value. In addition, because more investors than ever have money in US equities, this concentration leaves a greater proportion of assets exposed to falling share prices.
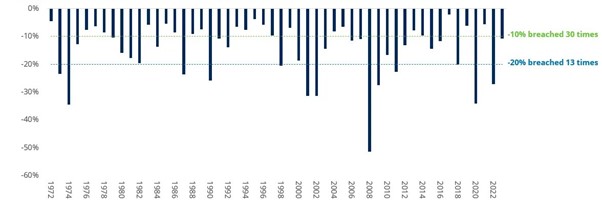
However, turbulence in markets should come as no particular surprise to regular readers of my updates. Bouts of volatility are not unusual. We experience falls of 10% more frequently than every other year, while 20% drops occur around every four years. The important thing to remember is that this doesn’t diminish the argument for investing in equities. They may be more volatile, but over longer terms they invariably win out. Indeed, corrections help to take some of the froth out of markets, lowering valuations and presenting opportunities for the active managers that we pair with our passive holdings.
Biggest stock market falls in each of the past 52 calendar years

Source: LSEG Datastream and Schroders, MSCI World index to 31/12/2023
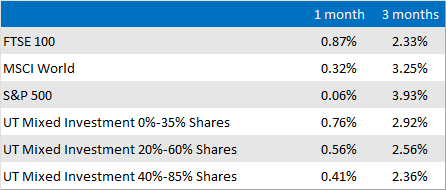
Having hit an all-time high in July, the main Japanese index fell by 25% in the next three weeks. The market has rallied strongly since then and all the main markets (including Japan) are still positive for the year so far. All of our models are in positive territory over the month and for the year. More importantly, at least in terms of demonstrating the strength of our approach, a recent internal analysis showed that our largest and longest running models (Cautious, Balanced and Growth) had grown by 60%, 80% and 100% respectively over the last 10 years (to 19/08/2024, source Financial Express Analytics).
This is very encouraging as amongst all the focus on beating this benchmark or that index, it shows that over the long term, our focus on ensuring consistent returns across our range has produced a clear delineation between risk levels; if you took more risk, you achieved a higher return and vice versa. This is contrasted to the portfolios' performance comparators (the UT Retail sectors) which are up 44%, 73% and 76% respectively over the same period as other investment managers were influenced by historically unusual levels of concentration in equity markets.
We attribute a lot of value to diversification and across all of our models we hold a range of funds, including equities and bonds, as well as cash and others which are designed to be uncorrelated with markets. By avoiding over-concentration in any single asset or sector and by not chasing trends, we aim to mitigate the impact of adverse events or market downturns to enable our clients to achieve their long-term goals.
Market and sector summary to the end of August 2024

Source: Financial Express Analytics.
Past performance is not a guide to future performance, nor a reliable indicator of future results or performance.

