
After the revelation that the UK fell into a technical recession at the end of last year, the latest data suggests that the downturn could be as short as many had predicted. January’s GDP figure came in bang on expectations at 0.2%, boosted by an expansion in the crucial services sector. The reversal was largely ignored by local markets given the lack of surprise, but Rishi Sunak will certainly be hoping that the trend continues as we get ever closer to the next election.
There was more good news for the government, and for UK consumers, with headline inflation falling to 3.4% in the twelve months to February. Whilst this doesn’t necessarily mean things have got better (rather the rate at which they were getting worse has slowed), this is a meaningful drop from the 4% seen in January and is the lowest level since 2021. The data adds to the pressure on the Bank of England (BoE) to start to cut interest rates, although with core inflation (excluding more volatile food and fuel costs) proving more stubborn there are still headwinds to be considered.
UK headline versus core inflation rate
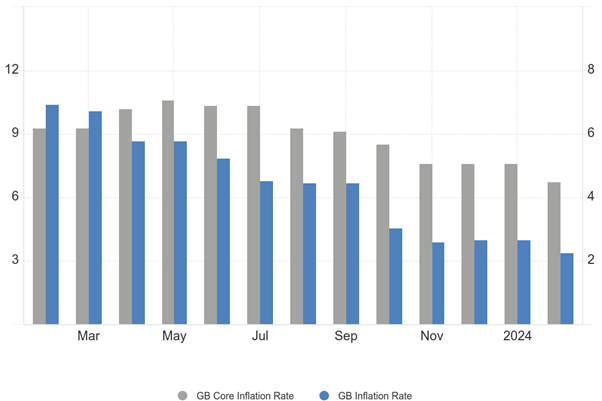
Source: tradingeconomics.com, data to February 2024
The BoE elected to make no changes at its most recent meeting, however, market expectations are starting to soften with the chance of the first cut coming in May rising to 20% according to Bloomberg. That’s double what it was a month ago, helped by the changing voting patterns within the bank's rate setting committee. The two members who previously voted to raise rates have now changed their stance, but despite this, only one vote was cast for a cut so there is still some way to go.
The more positive outlook was underscored by a report from the ratings agency Fitch which has upgraded the UK from negative to stable. The downgrade to negative was caused by the disastrous budget carried out during Liz Truss’ brief tenure and while Fitch acknowledged that there are still some challenges to face, the return to an AA- rating will be seen as a vote of confidence in the approach taken under Hunt’s reign.
In the US, annual inflation surprised by rising 3.2% in February, up slightly from January’s number. The small bump helped to cement the idea that the Federal Reserve (Fed) would not start to cut interest rates until at least June. Having elected to make no changes at its latest meeting, the Fed are still forecasting three cuts this year, although it now expects the total reduction to be smaller than previously stated.
Whenever it does come, the beginning of a new interest rate cutting cycle is statistically one that investors should cheer. According to research from investment firm Schroders, stocks have returned 11% above inflation in the 12-months after the Fed starts cutting rates, on average. The research, which was based on analysis of 22 rate cutting cycles since 1928, showed that average returns have been better if a recession is avoided but good even if one is not.
Performance of the US stock market when rates start to be cut
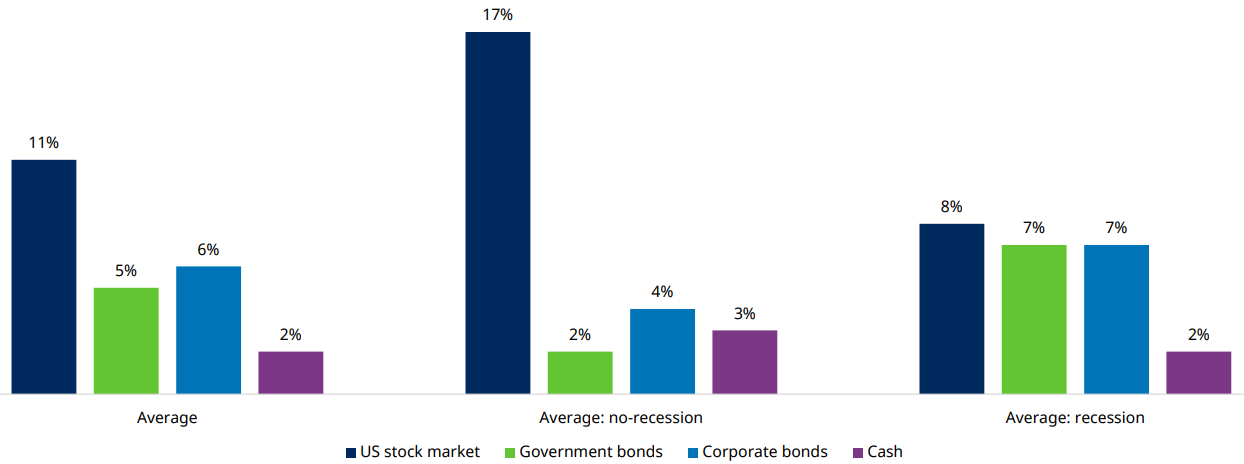
Source: Schroders, average 12-month real returns from the date of first cut, since 1928
Unusually, reducing expectations for US interest rate cuts didn’t seem to be accompanied by the typical market jitters that occur when investors think debt will remain expensive. The focus of such nervousness is usually on the largest and most expensive stocks, namely the Magnificent Seven (M7) which I wrote about in last month’s update. In August of last year, the combined value of the M7 stocks dropped by almost a trillion dollars in two weeks in response to concerns that the Fed would have to delay expected cuts to interest rates. That the market seems less concerned this time around gives further evidence to the idea that complacency has set in, which is rarely a positive sign.
To add to my comments in the last update about the scale of the return in this group of companies, the chart below highlights just how out of kilter it is compared to pretty much everything else. It shows the performance of the M7 versus the remaining constituents of the MSCI All Companies World Index. This index contains almost 3,000 stocks, including large and mid cap firms from both developed and emerging markets. The dominant performance of the best performers like Nvidia (which since last October has grown by twice as much as the total value of the Spanish stock market) and Meta is such that even being moderately underweight can have a big impact on relative returns.
Magnificent Seven versus the rest of the world
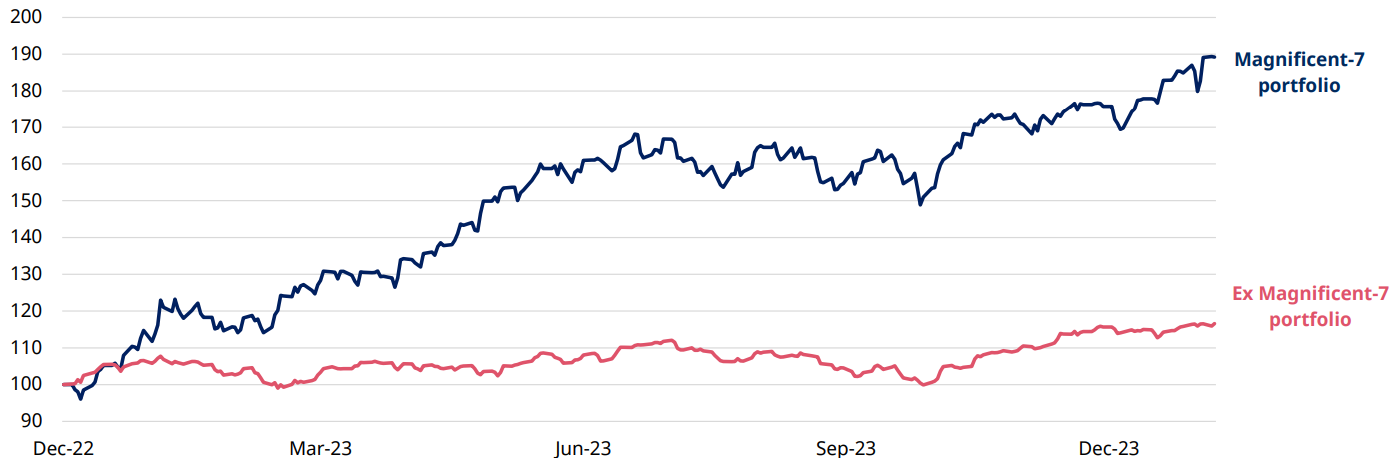
Source: Schroders, MSCI ACWI data to 6/2/24
Speaking of relative performance, we’ve also noted that the performance of the “Balanced” sector (investment strategies with varying proportions of stocks and bonds with a required stock weighting of between 40% and 85%) has basically tracked the performance of the “Growth” sector (up to 100% in stocks) for a year or more. This is very unusual and suggests to us that a lot of alternative portfolios and solutions have piled into US equities at the expense of diversification. I would question how sensible this is from a long-term perspective given the very recent volatility in the sector. When we manage the portfolios, our primary motivation is on ensuring they meet their mandates as these ensure we focus on meeting client objectives over the longer term.
Whilst we’re not expecting any of the M7 companies to go bankrupt, we are watching out for signs of higher interest rates causing problems for firms which took on a lot of debt when prices were cheap. As these firms have had to refinance their outstanding loans, they’ve been faced with much higher costs while at the same time having to cope with reduced consumer demand thanks to the cost of living crisis.
Recent S&P Global Ratings data suggest that more companies have defaulted so far this year than in any similar period since the global financial crisis in 2009. The absolute numbers are low because most companies don’t fail, they just suffer sharp share price falls, but it acts as a canary in the coalmine to highlight the challenges faced by many firms.
Corporate failures to February 2024
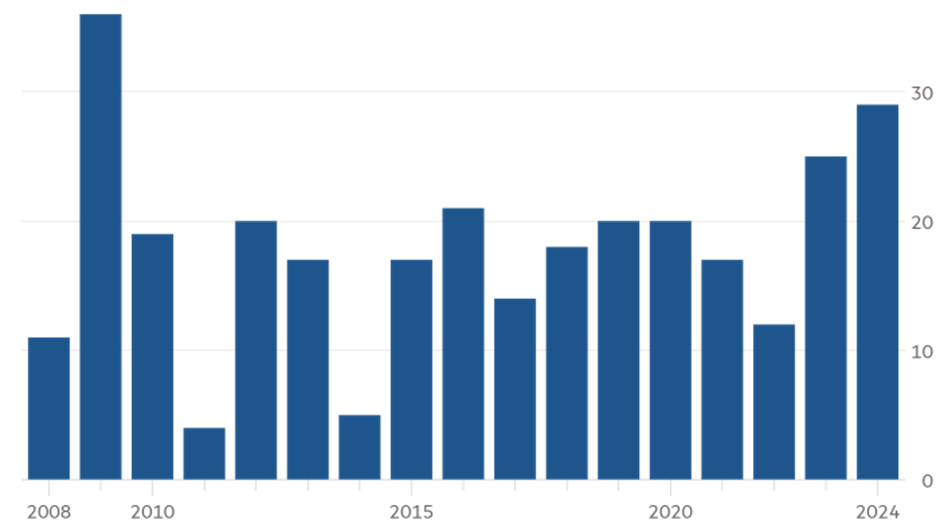
Source: FT.com / S&P Global Ratings
This proliferation of debt (both corporate and also that held by governments) gives us pause, especially in conjunction with the comments above about the apparent complacency currently infecting markets. We continue to strive to find a balance between having meaningful levels of exposure to the fastest growing markets whilst sticking to our core investment philosophy to seek out long term returns.
Market and sector summary to the end of March 2024
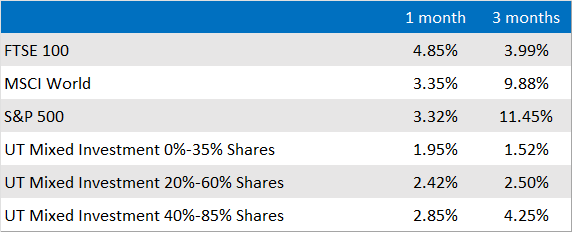
Source: Financial Express Analytics.
Past performance is not a guide to future performance, nor a reliable indicator of future results or performance.