Thank you to everyone who has already responded to the latest review of the IMS portfolios which was sent out last month. We’ve had an excellent response so far, but if you have not yet had an opportunity to send us your acceptance, we would be grateful if you could so that we can make sure your investments are in the latest fund selection. You can respond to this message if you would like another copy of the review to be sent out.
This month’s update is a little longer than usual as it focuses on two distinct themes, one local and one global. Both subjects are of interest to us from an investment perspective and they will also, I hope, provide an interesting insight into the detail behind some of the big stories of the moment.
Starting closer to home, we’ve recently had confirmation that UK GDP fell by -0.3% in the final three months of last year, officially placing the economy into a technical recession. This is only the first version of the data and there is a chance that it could be uplifted, however, with a fall of -0.1% in the previous quarter, the designation is likely to stick.
UK falls into recession
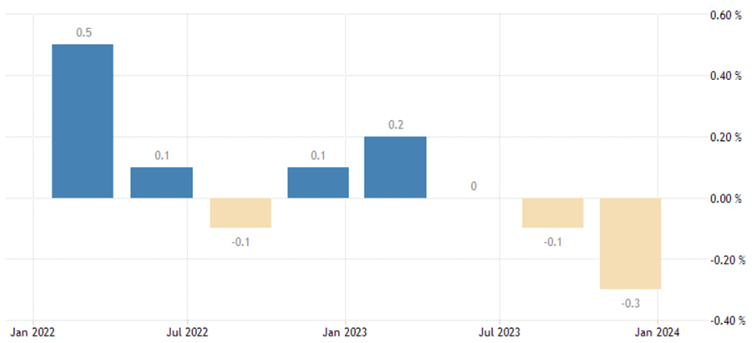
Source: Office for National Statistics
The phrase “technical recession” is used to describe two consecutive periods of negative economic growth based on the change in the value of all goods and services produced over the period. It doesn’t mean a lot more than that; an economy might be doing well by other measures, or it might be at the start of a full-on crash. Most economists believe that the current slump will likely be shallow and short-lived. It is relatively minor compared to those caused by events such as the Covid-19 pandemic, the credit crunch of 2008-9 and issues like the 3-day week and oil price shock in the 1970’s.
In reality, GDP is a pretty crude measure of the health of an economy from the perspective of the average Brit. It only highlights the total size of the economy; it says nothing about how that wealth is distributed. Arguably a better measure is something called GDP per capita – basically the total growth divided by the population. This gives a better idea of the lived experience of a population and is a fairer way of comparing between different countries.
Recent data released by the Office for National Statistics shows that our GDP per capita has fallen in every quarter since 2022, the worst run since 1995. Putting it another way, the UK’s GDP per capita growth rate grew by 11.9% between 2010 and 2022 compared to 12.7% for Germany and 18.7% for the US. This worsening long-term trend is a bigger concern for the government than a brief dip into a technical recession.
Long term GDP per capita, UK versus US
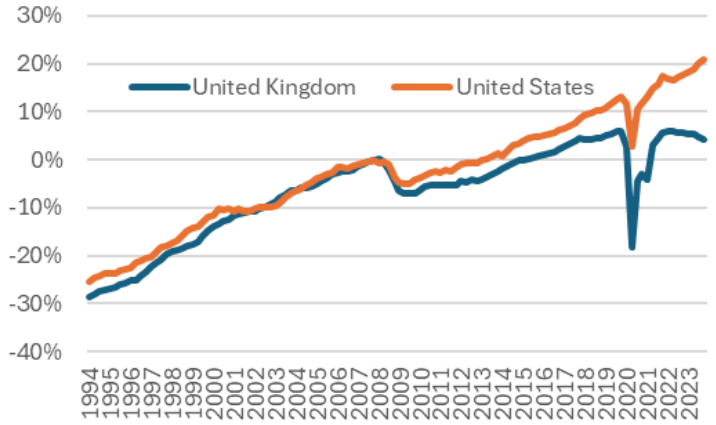
Source: Source: US Bureau of Statistics/UK Office for National Statistics
Of course, it is also a factor that forms part of the decision process for the Bank of England (BoE). Its decisions about raising or lowering interest rates are designed to keep the economy on an even keel with a target for inflation of 2%. With employment rising and business confidence remaining robust it’s unlikely that they’ll put too much weight on the fall in GDP, but they’re certainly aware of the risks of keeping interest rates high given the impact it has on growth.
Another key factor is inflation which remained at 4% in January, twice the BoE’s target. The rate had actually been expected to rise slightly to 4.2% because of recent disruption caused by events in the middle east and attacks on shipping through the Suez Canal. As highlighted at the review, costs have risen over 300% with ships taking a 4,000-mile detour to avoid the area. Hopefully this is a sign of resilience in consumer demand rather than a delayed impact.
Satellite image showing the dramatic drop in traffic via the Suez Canal in January

Source: US Bureau of Statistics/UK Office for National Statistics
Rounding off this first theme about the importance of looking deeper into data, I thought I’d finish with an anecdote about the risks of taking numbers at face value. Inflation has now held at 4% for two months, but in December it unexpectedly increased from 3.9%. The reaction was strong with the FTSE 100 falling 1.8% on the day because traders feared it would cause the BoE to delay cutting interest rates. Looking more closely though, the actual change was a move from 3.94% to 3.95%, a difference of just 0.01%, however, because the Office for National Statistics rounds to one decimal place, the reported level moved from 3.9 to 4%. This serves as a stark reminder that the devil often lies in the decimal details.
The second area on which I want to focus is the continuing domination of the Magnificent Seven (M7). This is the name given to Alphabet, Amazon, Apple, Meta, Microsoft, NVIDIA and Tesla, a group of very large US companies which are connected based on a broad technological theme.
I’ve mentioned them previously because they have been responsible for a great deal of the returns for US markets which have been some of the strongest performers on the global stage over the last year. I want to delve into the impact of the M7 both on helping to make the US stock market look stronger than it might actually be as well as on the risks that come with so much money being directed into such a small number of companies.
The main US market, the S&P500, has risen nearly 30% over the last 12 months. By contrast, the main European index is up around 8% over the same period while the FTSE100 is down around 3.5%. The reason for this difference is essentially the performance of the M7 over the last year:
The (mainly) Magnificent Seven 12-month performance
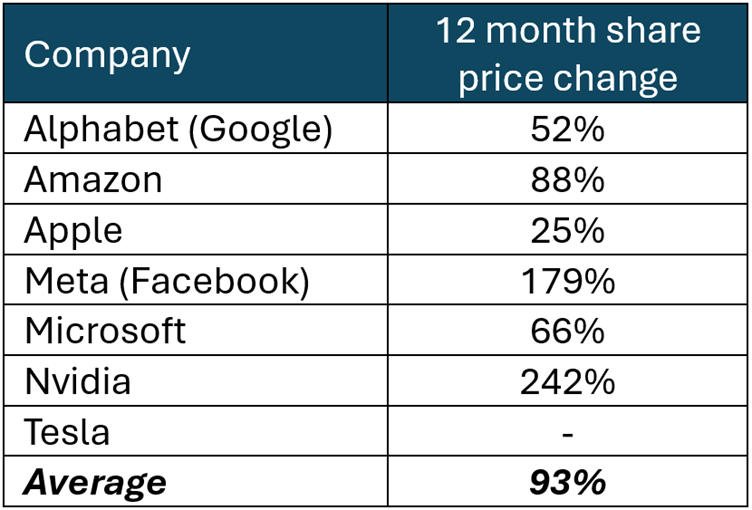
Source: www.google.com/finance, data to 29/02/2024
The average performance for the group is over 90% and given they make up around 30% of the total index, this tells us that the other constituents are doing far less well. In fact, the share prices of around 150 of the 500 companies in the index remain below their respective pre-Covid levels.
The M7 are not immune from underperformance either. As you can see above, Tesla’s share price is flat over the last year and it has struggled recently as competition in the electric car market has increased. In an earnings report at the end of January it confirmed that the company had missed expectations and lowered its guidance for future updates. The reaction was swift with the share price falling 10% in response. The share price has recovered a little since then but as at the time of this update, the company remains outside of the top 10 most valuable companies in the index, somewhat undermining the convenient moniker.
Despite this, clearly the rest of the M7 are faring much better and it’s worth highlighting just how extreme some of the recent moves have been. Earlier in February we heard from Meta (Facebook’s parent company) that their earnings were higher than expected which led to an immediate spike in its share price. The $205bn jump (an increase of 20% in a single day) was, for about two weeks, a record for a one-day increase. However, this was nothing compared to Nvidia’s recent meteoric rise.
The company has experienced substantial growth driven by enthusiasm for the potential of artificial intelligence (AI). Its microchips, integral to this rapidly expanding technology, play a pivotal role. After a company update affirmed the surging demand for its chips, the share price leapt by 16% on the day. To put this into perspective, the resulting $273 billion surge surpassed the total market value of major corporations like Coca-Cola and Bank of America. Remarkably, among all the companies in the index, only 26 have individual values exceeding this leap. In other words, Nvidia's one-day jump was greater than the market cap of 95% of the companies in the entire S&P500.
Nvidia's update also showed that almost half of the company’s revenue gets turned into pure profit, much higher than its peers, and its latest revenue is double that of a year ago, six times what it was just five years ago. It’s this rapid growth that has seen it become the third most valuable stock in the index at almost $2tn. Only Microsoft and Apple are ahead of it, sitting at around $3tn. These three companies alone make up more than 15% of the total value of the entire index.
These are extraordinary numbers, and they’re helping to maintain enthusiasm in US markets. Despite repeated warnings from the US Federal Reserve that they’ll be cutting interest rates slower than expected, traders have been piling money into equities. The latest Bank of America survey indicated that $18bn has been moved out of cash with most of it being redirected into shares. We’ve also recently seen that the total value of passive assets (those which simply track an index) have overtaken active assets for the first time:
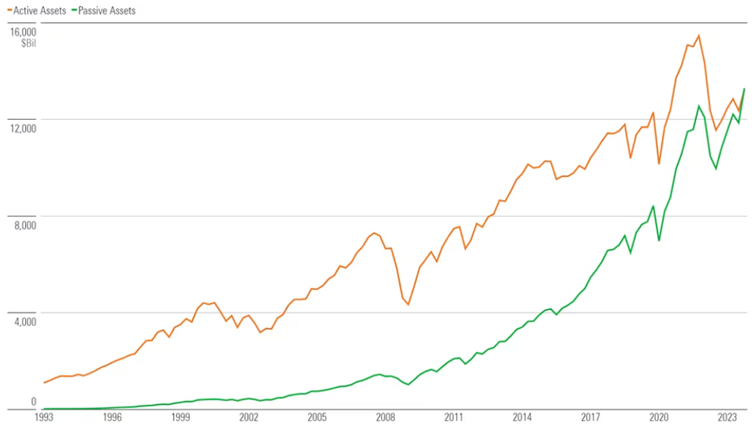
Source: Morningstar as at 31/12/2023
This last point is especially significant as it means that for every dollar that’s invested, more than 50 cents will now go directly into the biggest companies. This is completely indiscriminate; there is no accounting for the future prospects of the company or whether its share price is falling or rising. Bad news (like Tesla's earnings report) will carry less weight as there will be less and less human involvement in share price moves. This is a theme that I think will become increasingly important over the coming years.
At the moment it’s relatively easy to make an argument for the strength of the US market; interest rates are unlikely to go higher so “safe” returns will start to decline keeping shares popular, unlike Europe the country looks to be well placed to avoid a recession, and the recent earnings season seems to have confirmed that many companies are doing well. We invest heavily in the US via a number of different funds across our portfolio range to benefit from this trend. However, we are mindful that the largest companies are highly correlated as we saw in 2022 when the big tech firms experienced falls of between -20% and -66%, losing nearly $4tn in value for investors in the process.
As a result, we take deliberate steps to invest our clients’ assets into a wide range of different types of investments around the world. This can lead to periods where our portfolios don’t grow quite as fast as those which are more heavily exposed to this single, rapidly growing sector, but we are confident that over the longer term, this is by far the better approach to take.
Market and sector summary to the end of February 2024
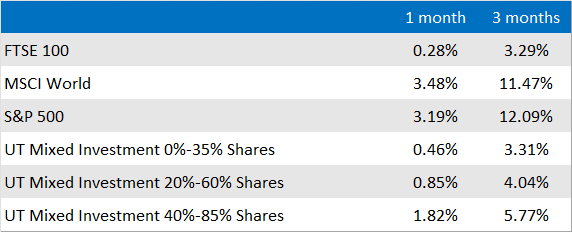
Source: Financial Express Analytics.
Past performance is not a guide to future performance, nor a reliable indicator of future results or performance.