
Thank you to everyone who has already responded to the latest review of the IMS portfolios which was sent out last month. We’ve had an excellent response so far, but if you have not yet had an opportunity to send us your acceptance, we would be grateful if you could so that we can make sure your investments are in the latest fund selection. You can respond to this message if you would like another copy of the review to be sent to you.
In the update that went out with the review I talked about the importance of understanding the different types of risk and our focus on constructing portfolios with a diverse range of holdings so as to avoid being overexposed to individual sectors or regions. Whilst risk is a key element in our process, I thought it would be useful to expand on how it connects to the wider approach we take when constructing our portfolios.
All of the IMS portfolios have a mandate that specifies a minimum and maximum level of equity which sets the tramlines between which we have to remain. Below this high level view there are a number of other constraints that detail the maximum and minimum weight we can allocate to a fund, how many sectors we must include, and so on. These mandates were set out when the portfolios were originally created and they form the framework around which we build our asset allocations and fund selections.
The purpose of the mandates is to give us a set of rules to work around so that you and your advisers can set expectations about how the portfolios might behave and also to ensure that individual portfolios do not take on inappropriate levels of risk. The word “inappropriate” is key here and I chose it because it helps to highlight that we are not solely focused on making sure that the portfolios are not excessively risky; we also want to ensure they take on enough risk where it is relevant and sensible to do so.
The mandates were created specifically by us so that they work alongside our processes and, crucially, our internal attitude to risk questionnaire and the strategic asset allocations (SAA) which this links to. Whilst the long-term SAA change over time, as do the allocations within the portfolios, the mandates give us the ability to place the models within well-known industry sectors so that we can assess our performance versus other similar instruments. However, our priority will always be to stay within the tramlines that we originally set and to apply our views on markets and funds within these guides.
The benchmarks that we have selected are by their nature very broad. Taking the one that is used with IMS Balanced as an example, this shares the same minimum and maximum equity allowance: 40 to 85%. Clearly this allows for a large degree of variance in terms of the approaches used and the level of risk taken. Broadly speaking, when markets are moving upwards, those portfolios that are closer to the maximum equity level will do much better than those that are at the other end of the scale and the opposite will usually be true when markets are falling. Even within these limits there is a lot of scope for divergence – a portfolio with 40% in emerging market equities may well outperform a portfolio with 85% in “boring” blue chip equities during a market rally.
To illustrate how extreme this divergence can be, I have put together the chart below which covers the 12 months to the end of April:
Quartile performance for funds in the 40-85% Equity sector

Data source: Financial Express. Data to end of April 2021
This breaks down the 40-85% equity sector into four quartiles, with the top 25% of assets on the left-hand side moving to the bottom 25% on the right. In each of the sections I have marked the position of the best fund, the worst fund, and the average fund.
The first aspect to point out is that the best fund in the sector over this period returned a remarkable 67% while the worst fund produced only 6.7%. Even though both options had the ability to invest the same amount in equities, they demonstrably took a very different approach in terms of which assets they selected. That is not to say that one fund is necessarily better than another and, as investors, the question we would ask when looking at the two options is whether they were operating within their mandates because that is more relevant than simply knowing where they sit in a performance table.
Looking at the gulf between best and worst funds is interesting, but I think it is more instructive to look at the average fund performance across the sector. Going from best to worst these were 30%, 23%, 20% and 16% so whilst the best fund achieved 10 times the return of the worst fund, the difference in the average returns is much less pronounced. This point is very important when it comes to the IMS portfolios because it shows that it is quite possible for them to move between quartiles over time, even if their allocations do not change by a large degree, as a result of the different themes that come and go over any given period.
You might remember that earlier in the year I produced an update which showed the relative performance of the IMS portfolios versus their benchmarks over the 10 years since the inception of the IMS service. This update (which can be read here) illustrated the success of our process over the decade and one of the driving forces behind this success has been our consistency. A fund that does particularly well in one period has a higher chance of underperforming when conditions change because it has to take significant bets on particular outcomes.
The IMS portfolios have always aimed to produce returns without relying on extremes and whilst that might mean that when markets are in full throttle we might not benefit from all of the upside, it has historically protected them when conditions are less clement. When we research funds, we want to understand how the fund is constructed, in what conditions it does well and when it might struggle, and what mandate it follows. One of the biggest red flags for us is when funds move away from their own rules and we rigorously apply this approach to our own portfolios.
Market and sector summary to the end of May 2021
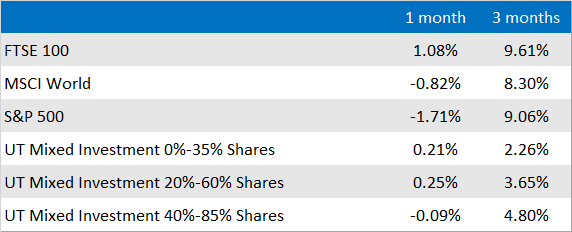
Source: Financial Express Analytics. Past performance is not a guide to future performance, nor a reliable indicator of future results or performance.